
 myCSUSM


Utility Consumption Charts
CSUSM Utility and Waste Metrics Over Time
Electricity
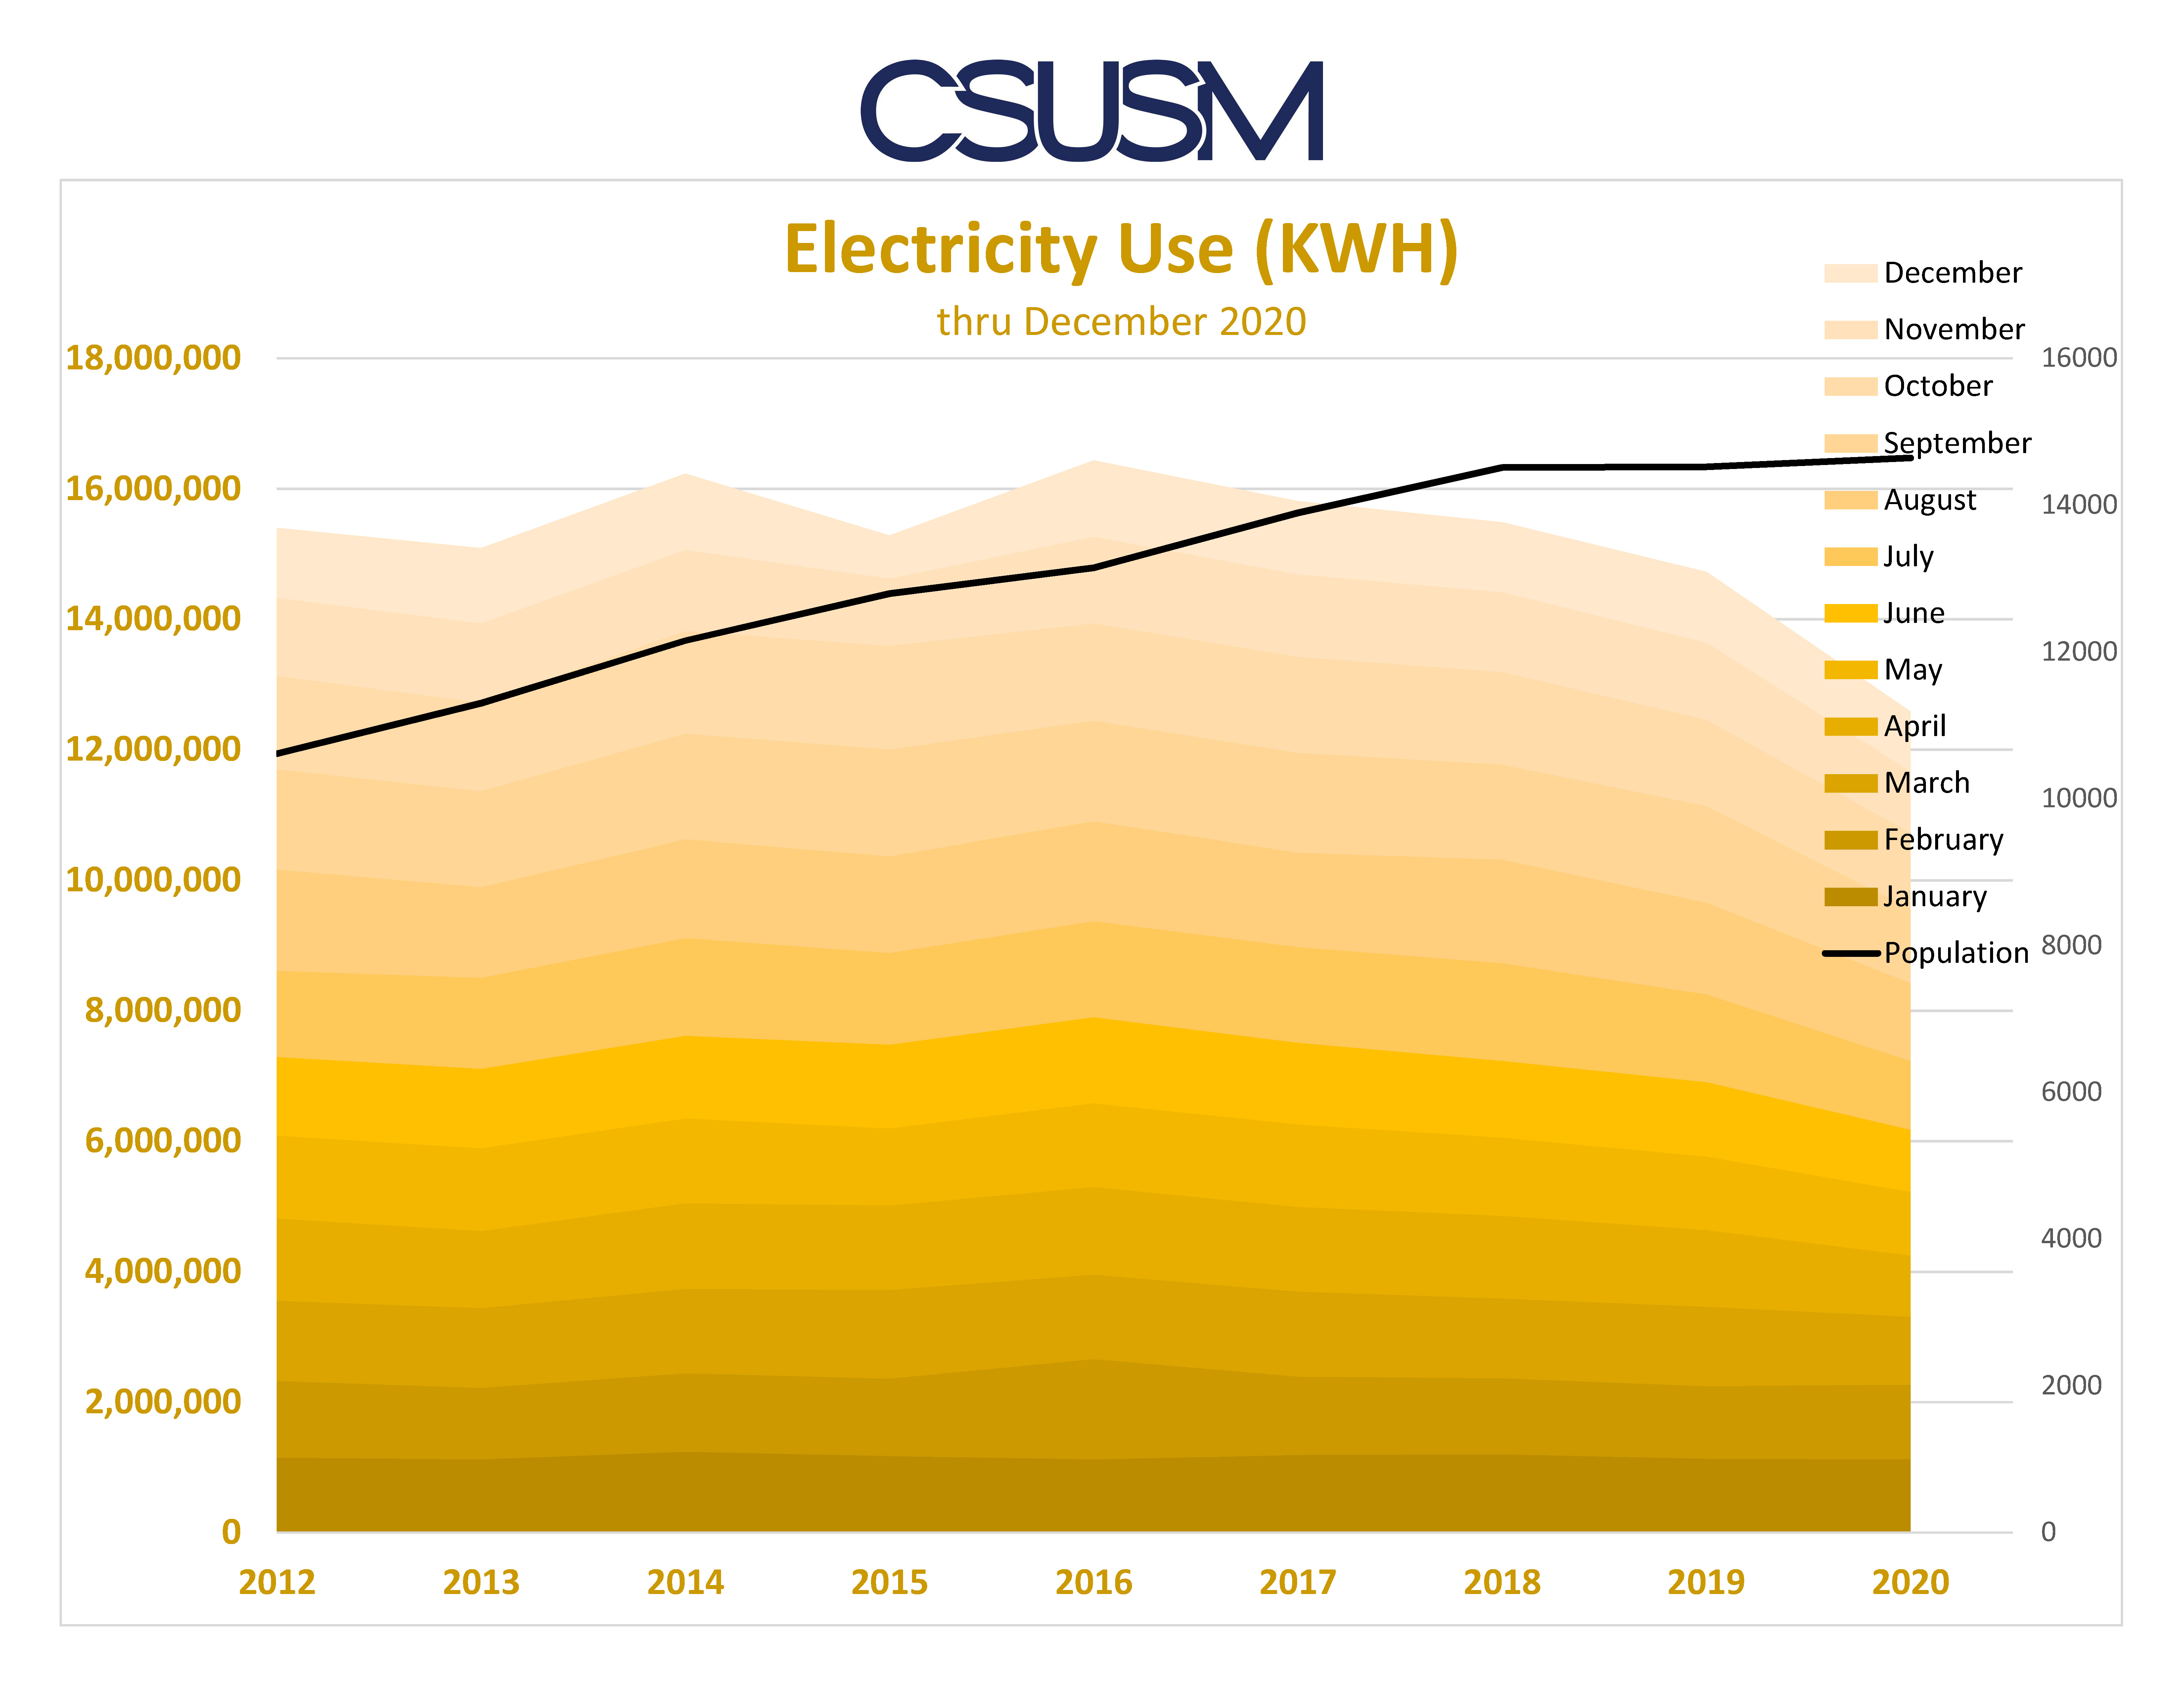
From 2010 through 2015 electrical usage slowly increased as the campus grew. In January 2016 the fuel cell was installed to decrease electrical usage.
Gas
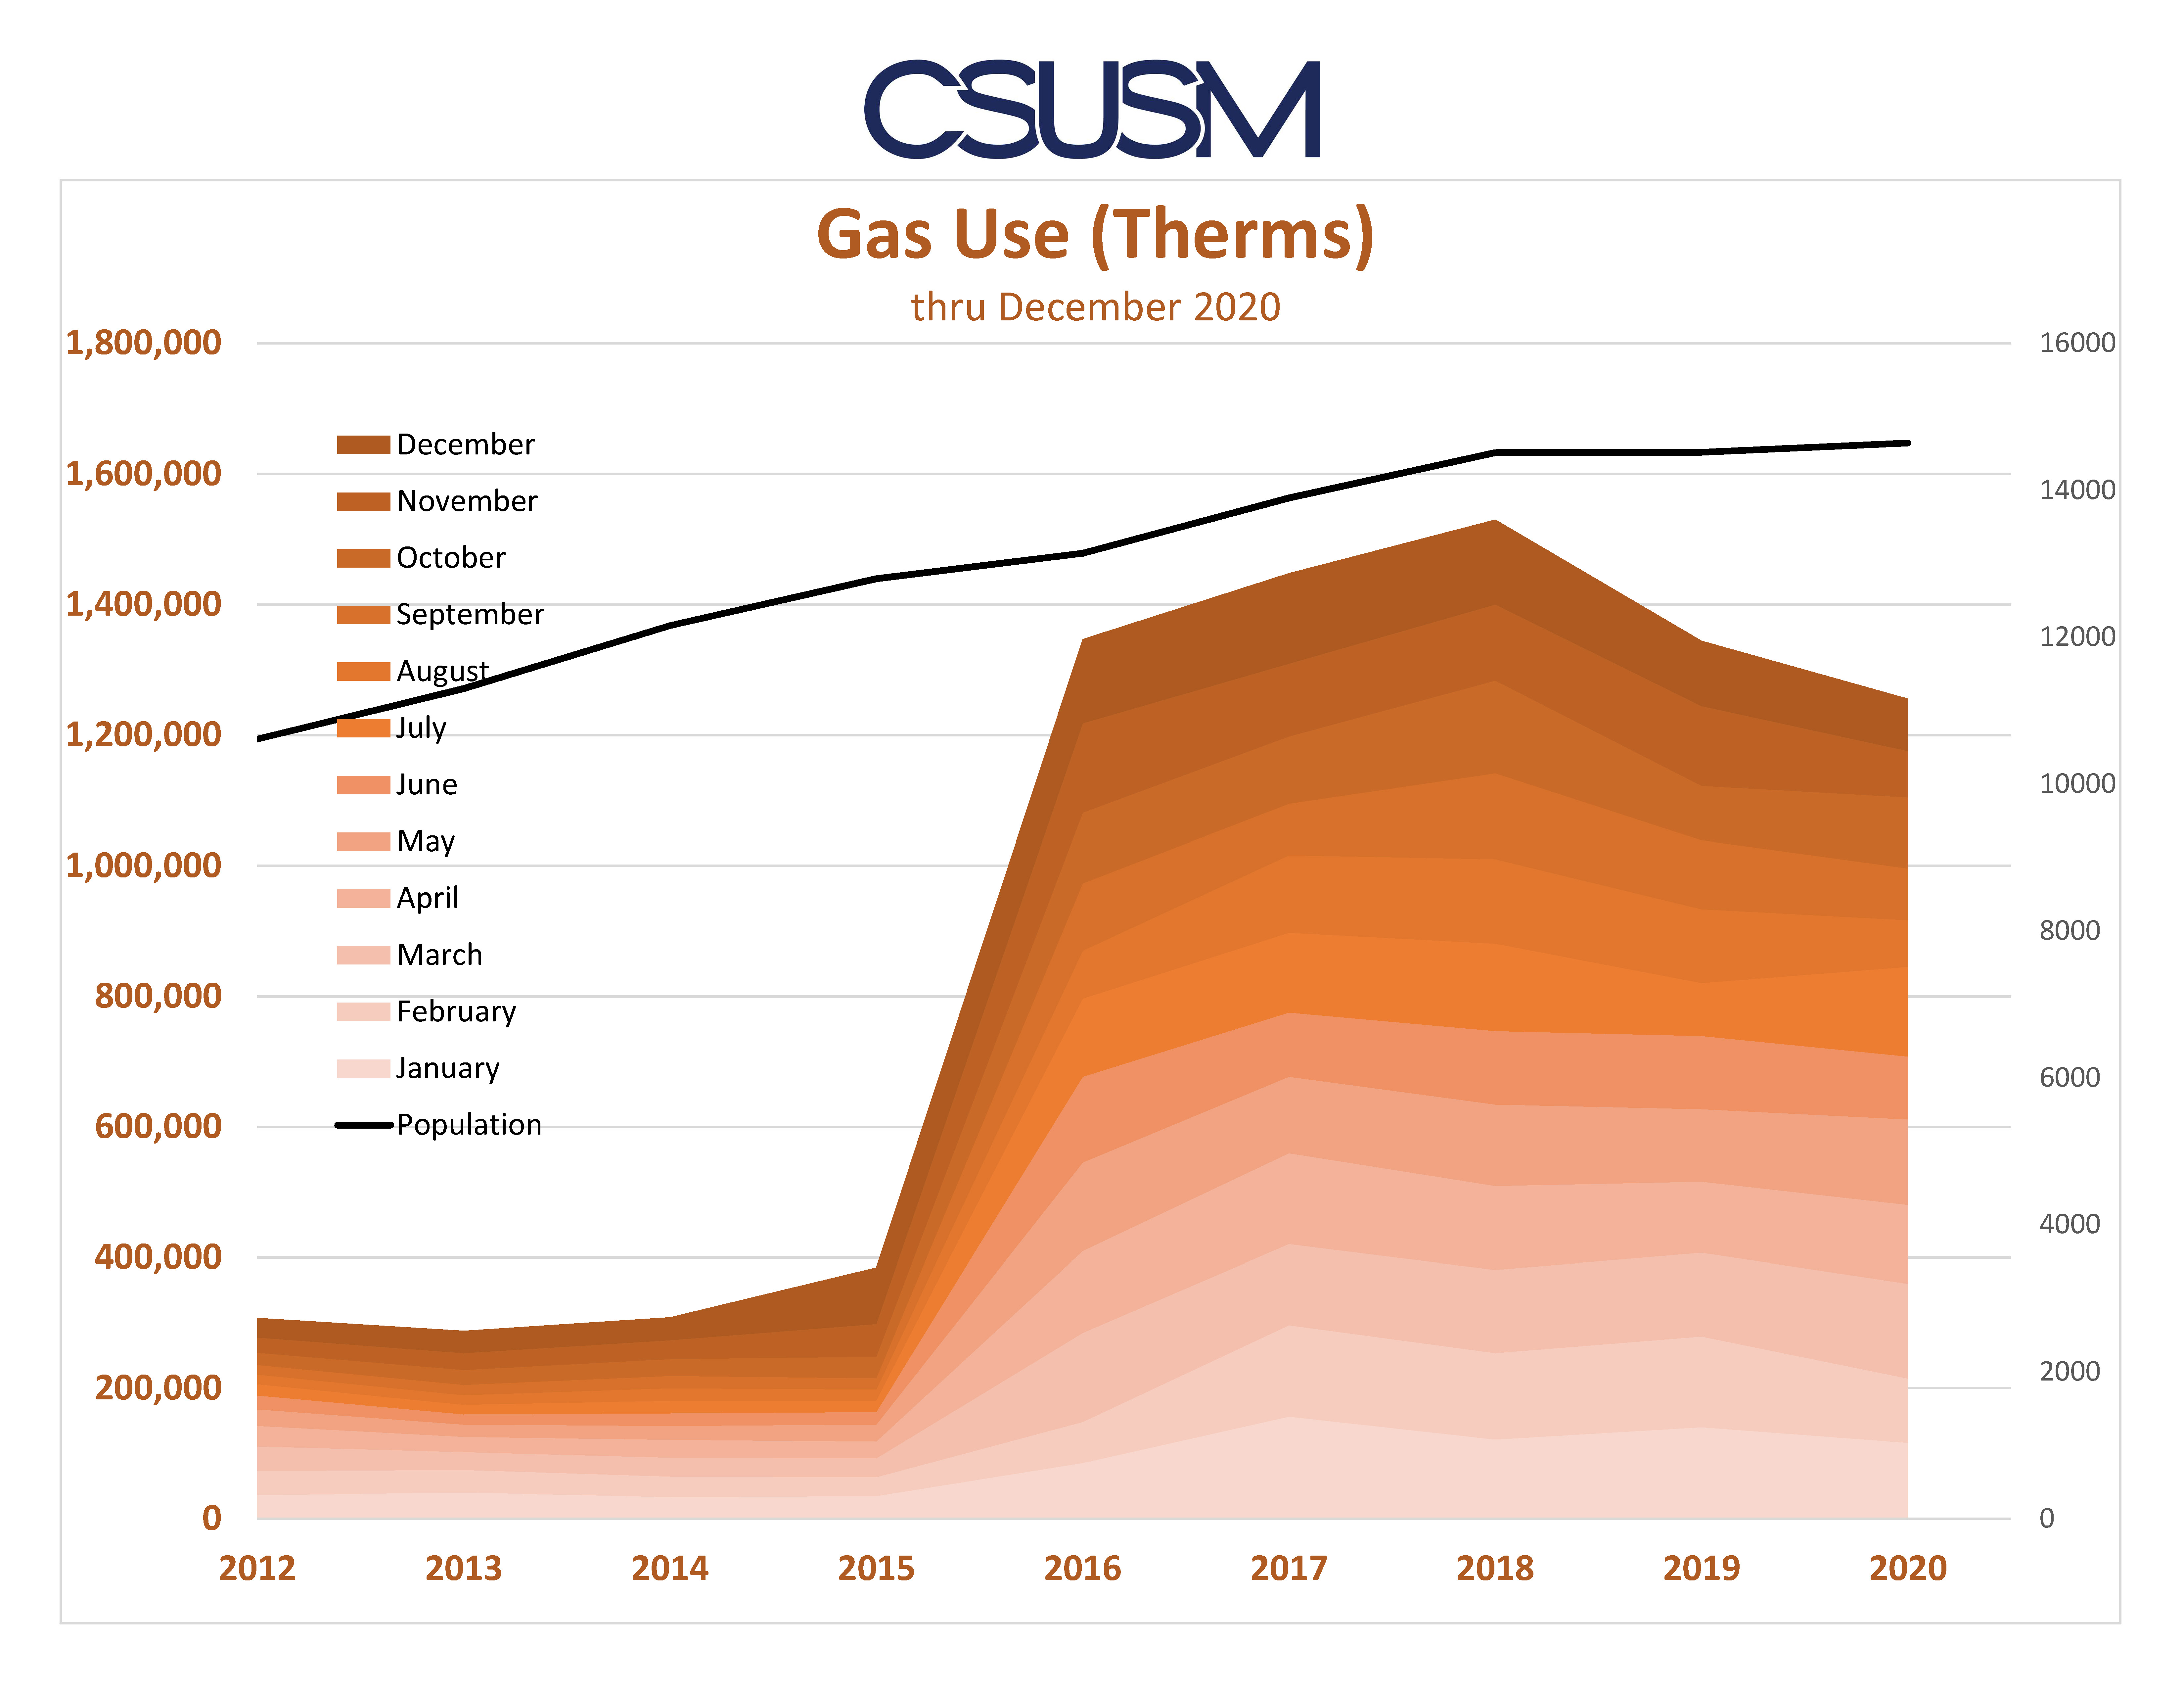
From 2010 through 2014 gas usage remained fairly consistent, with an increase in 2015. In January 2016 the fuel cell was installed which dramatically increased gas usage.
Sewage
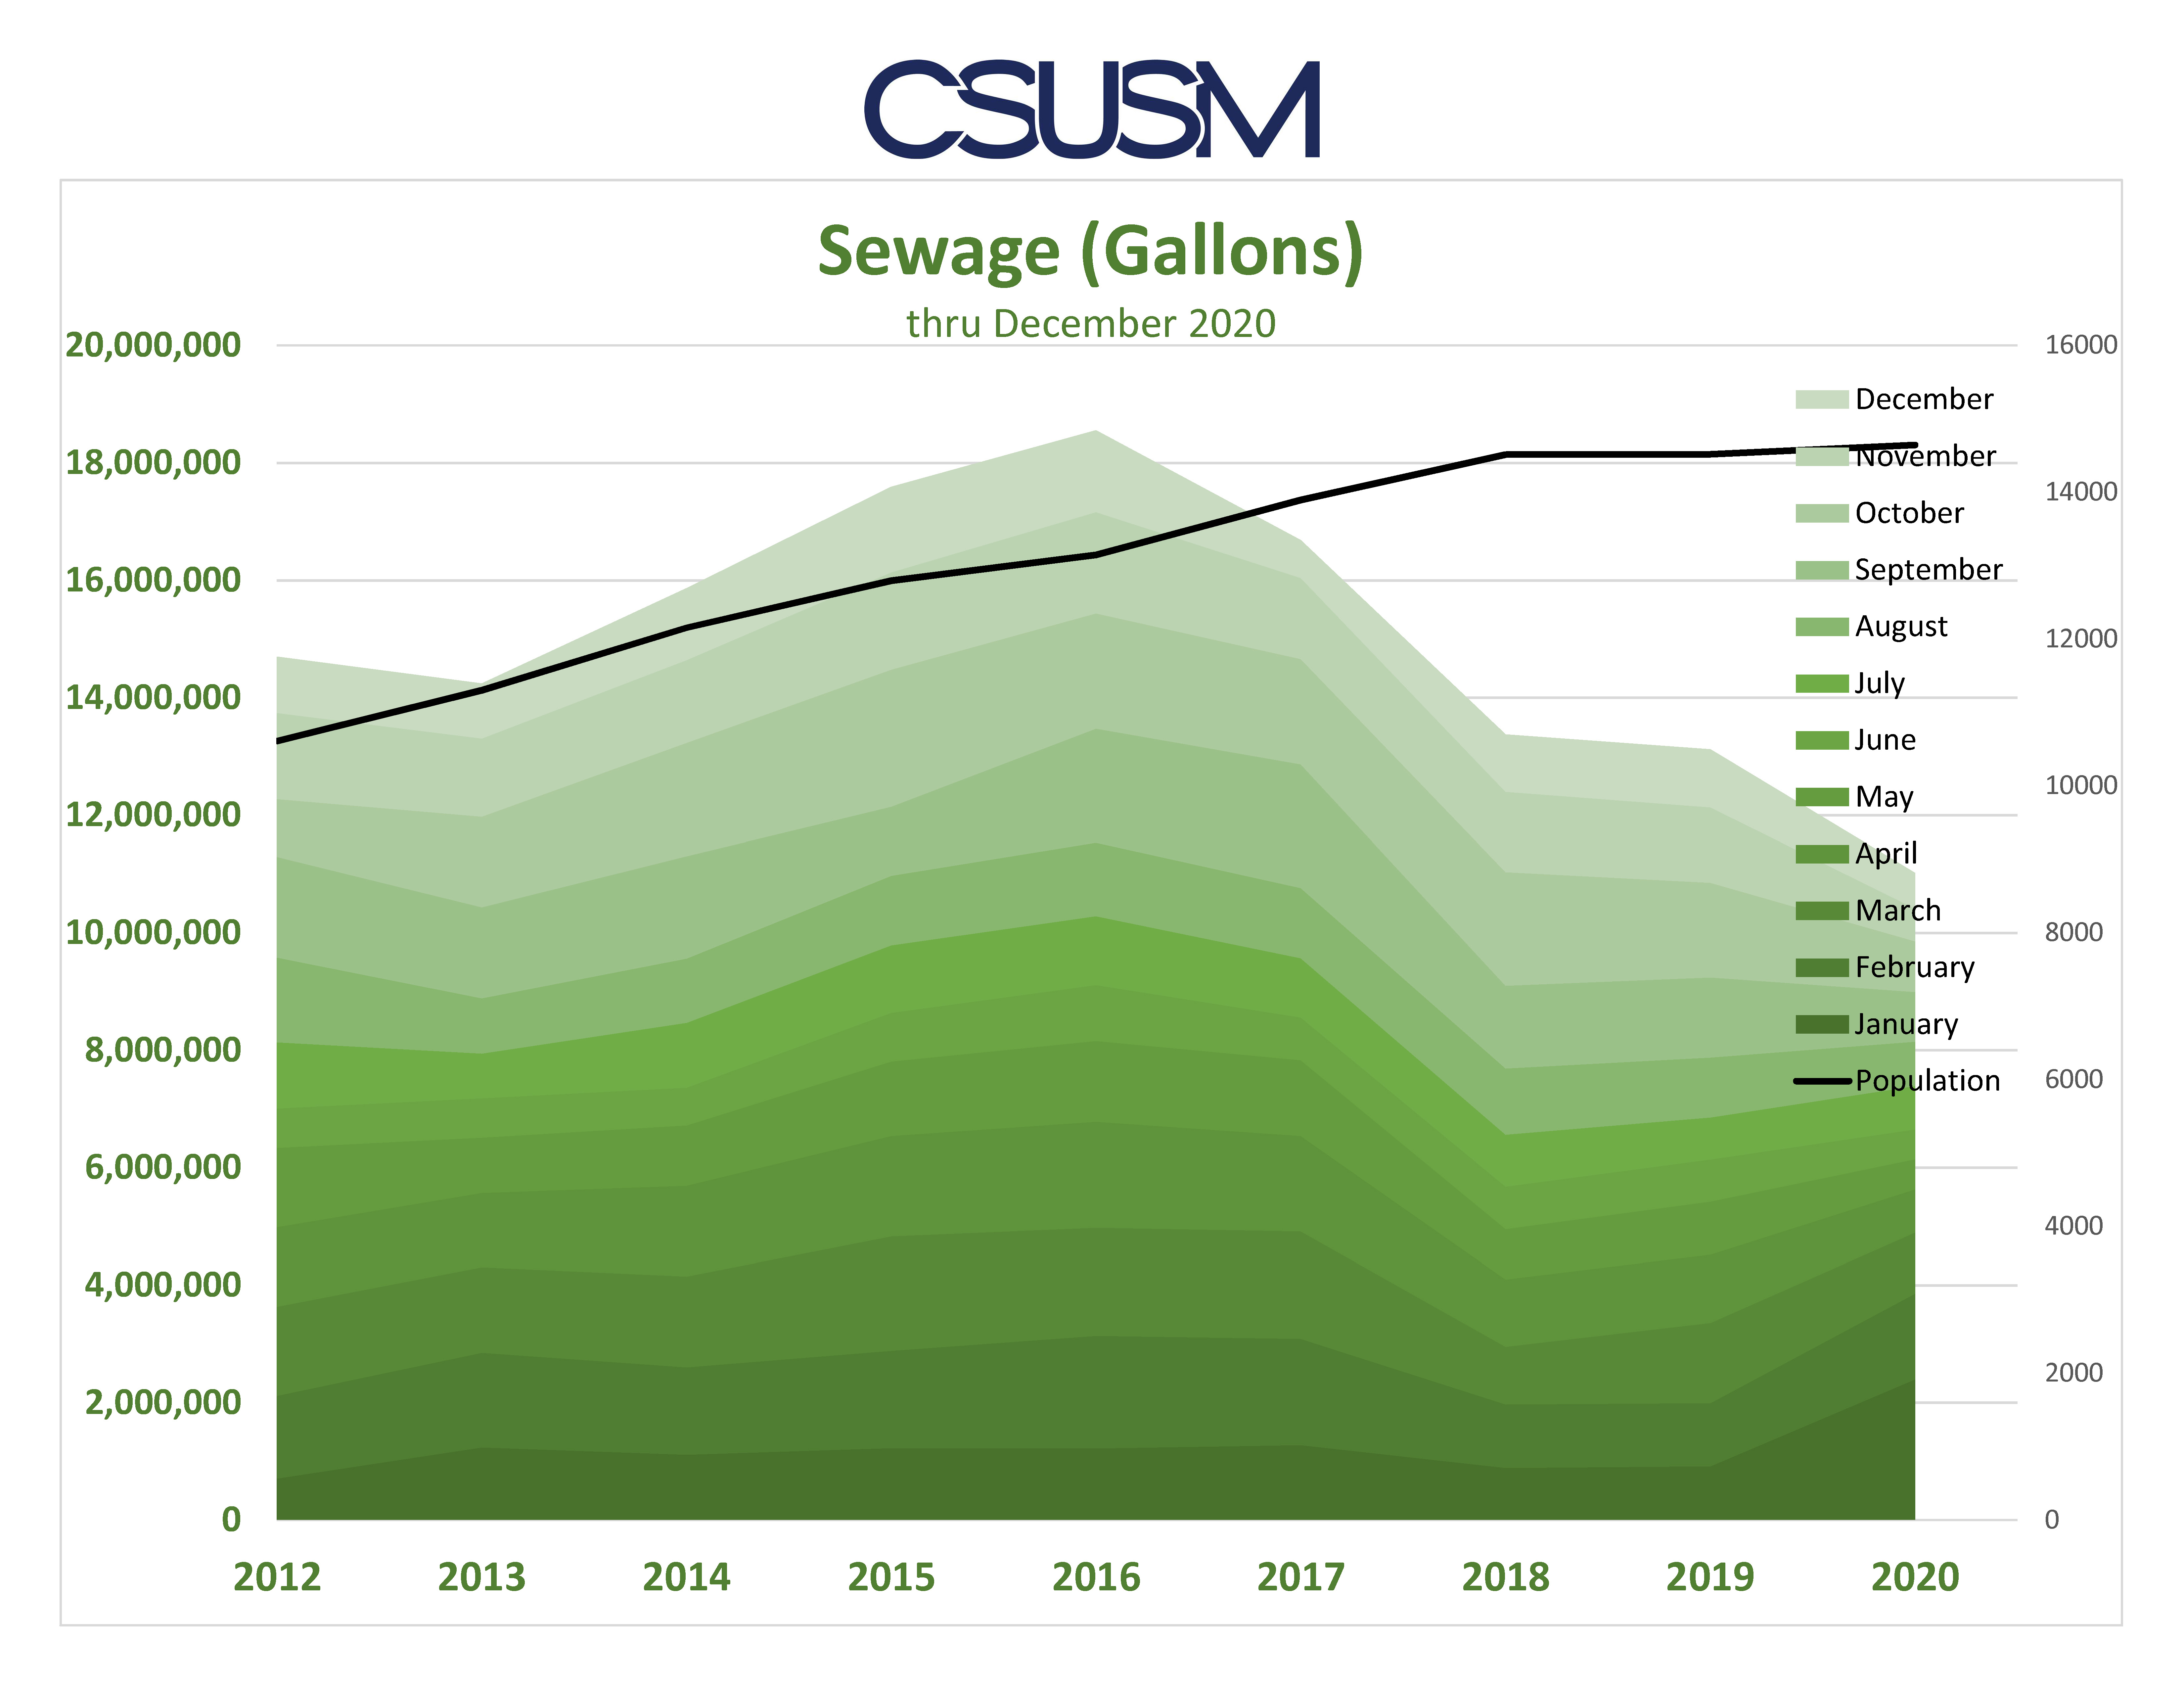
From 2010 through 2016 the sewage rates have increased as the campus has steadily grown.
Water
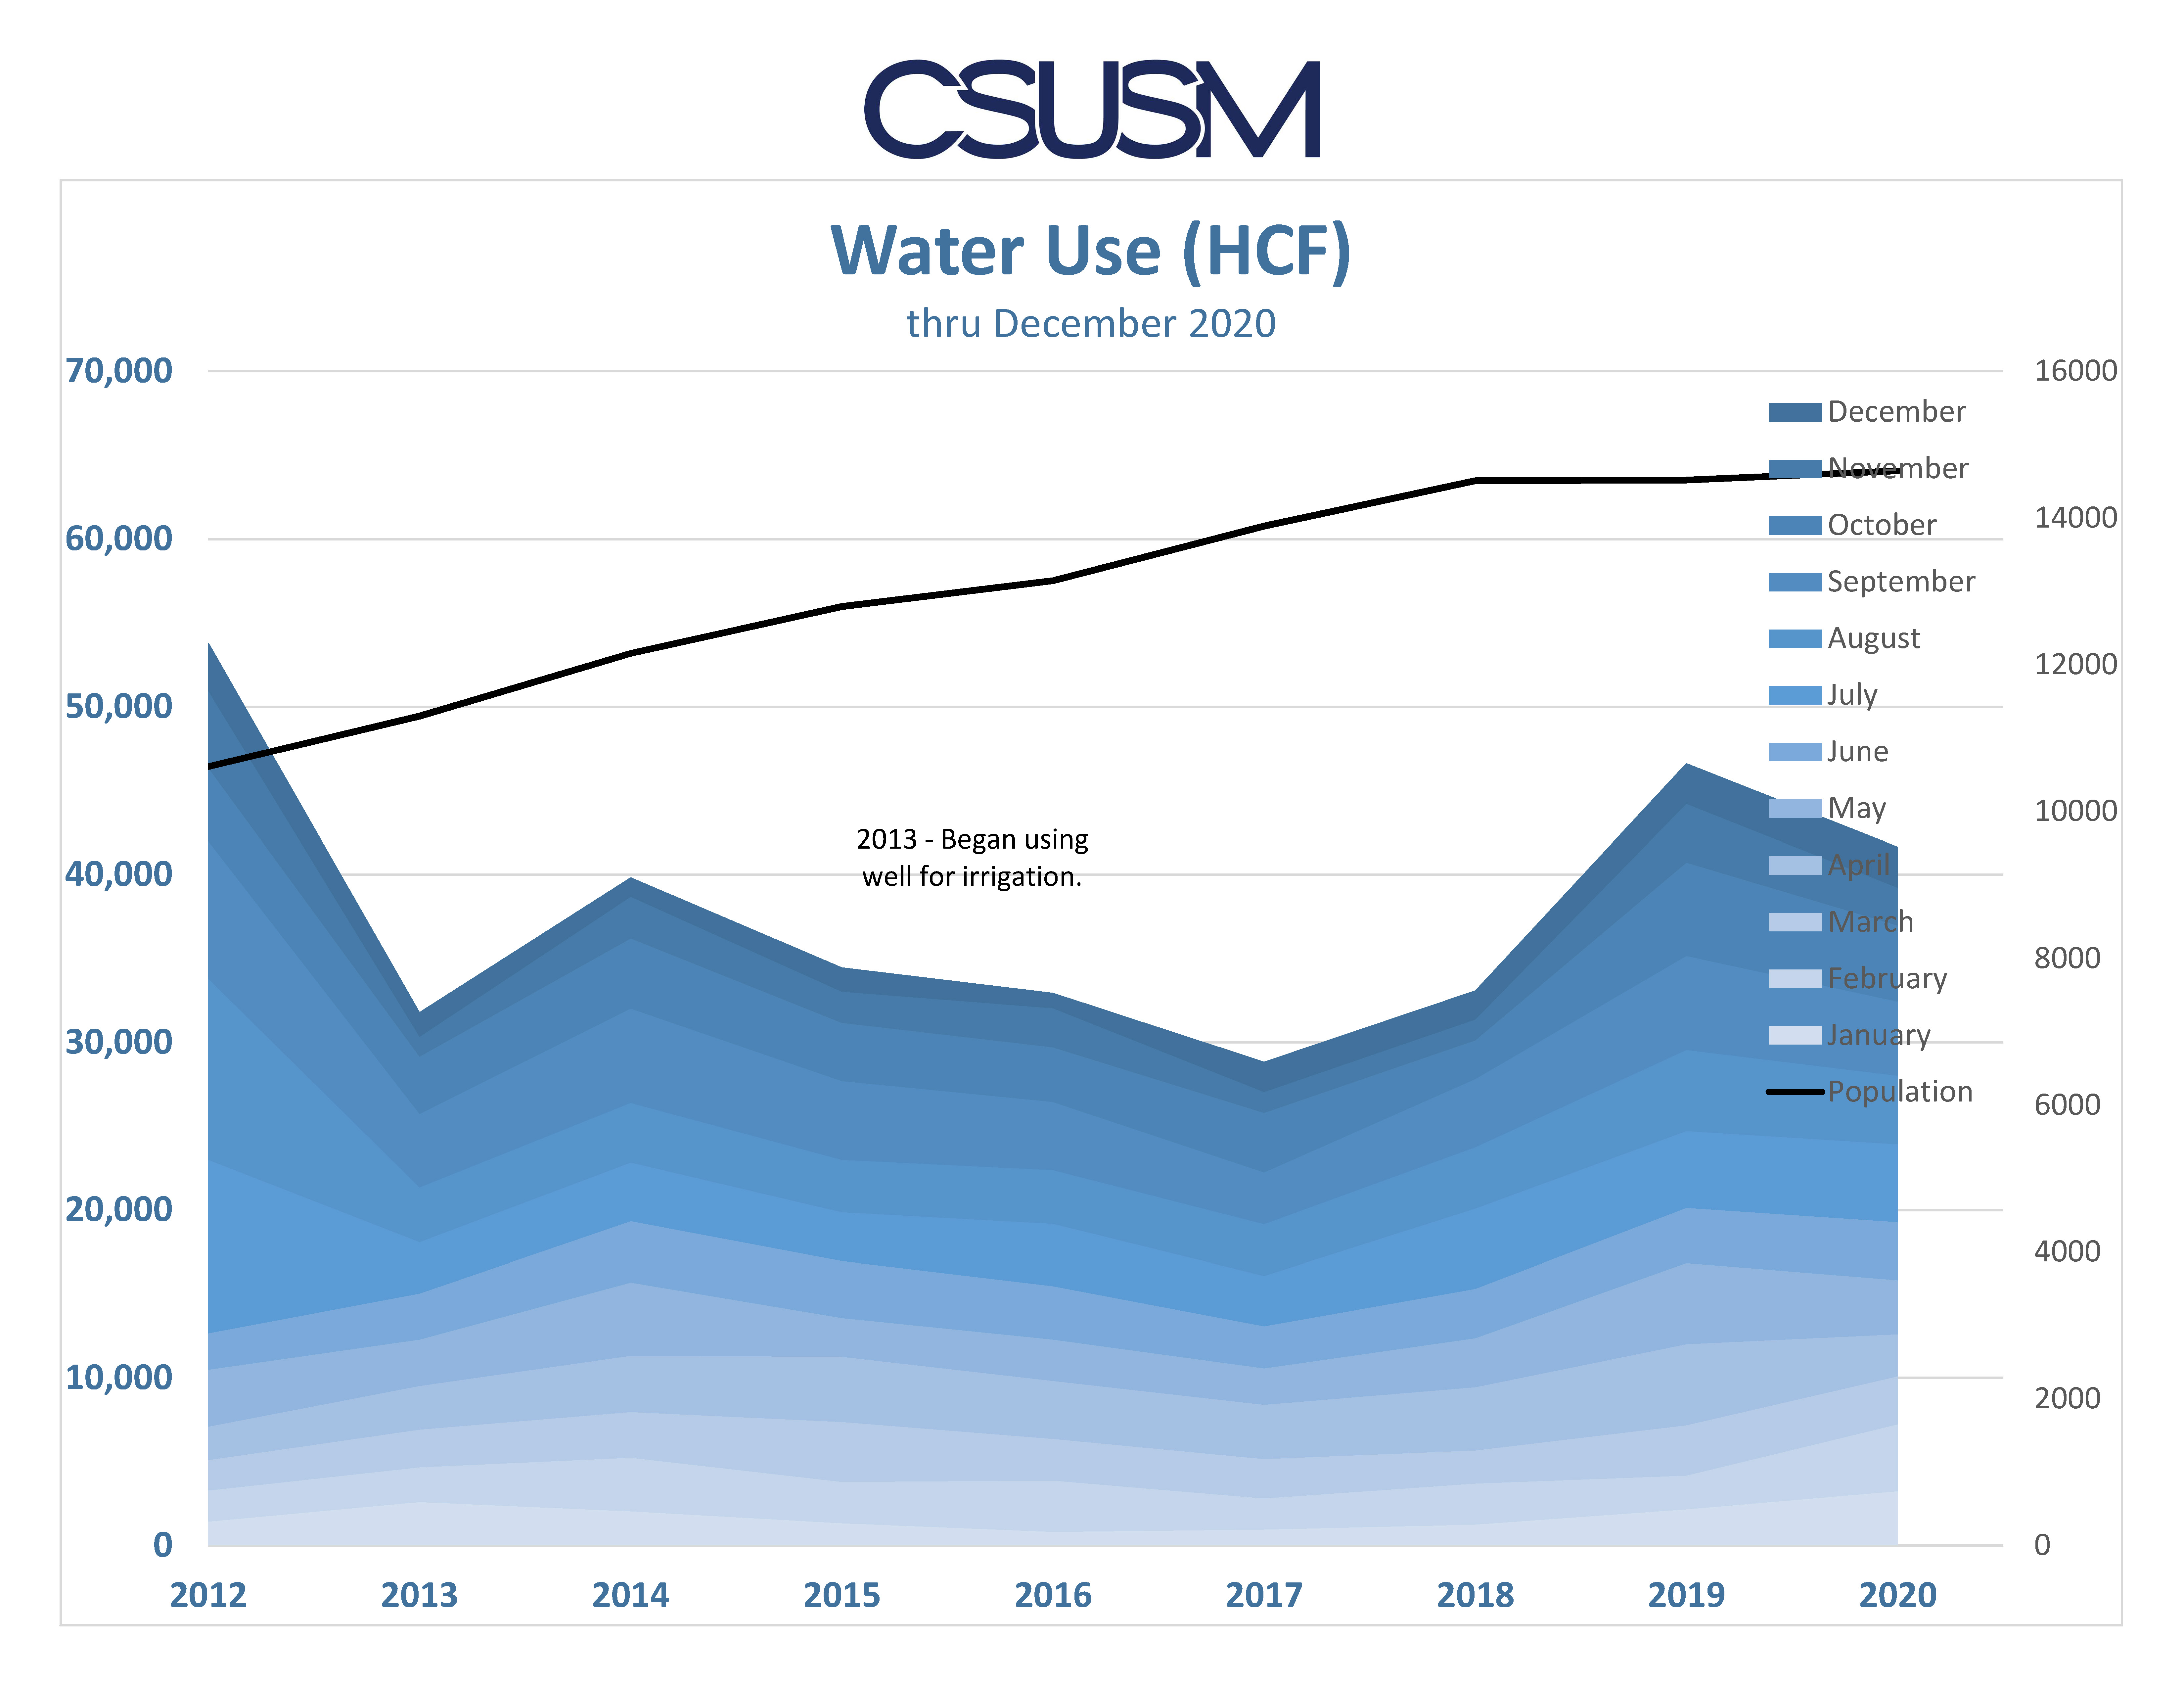
Since 2010 the campus has made several efforts to decrease our water usage. In 2013 the campus well became operational which is used for watering landscape.
Waste
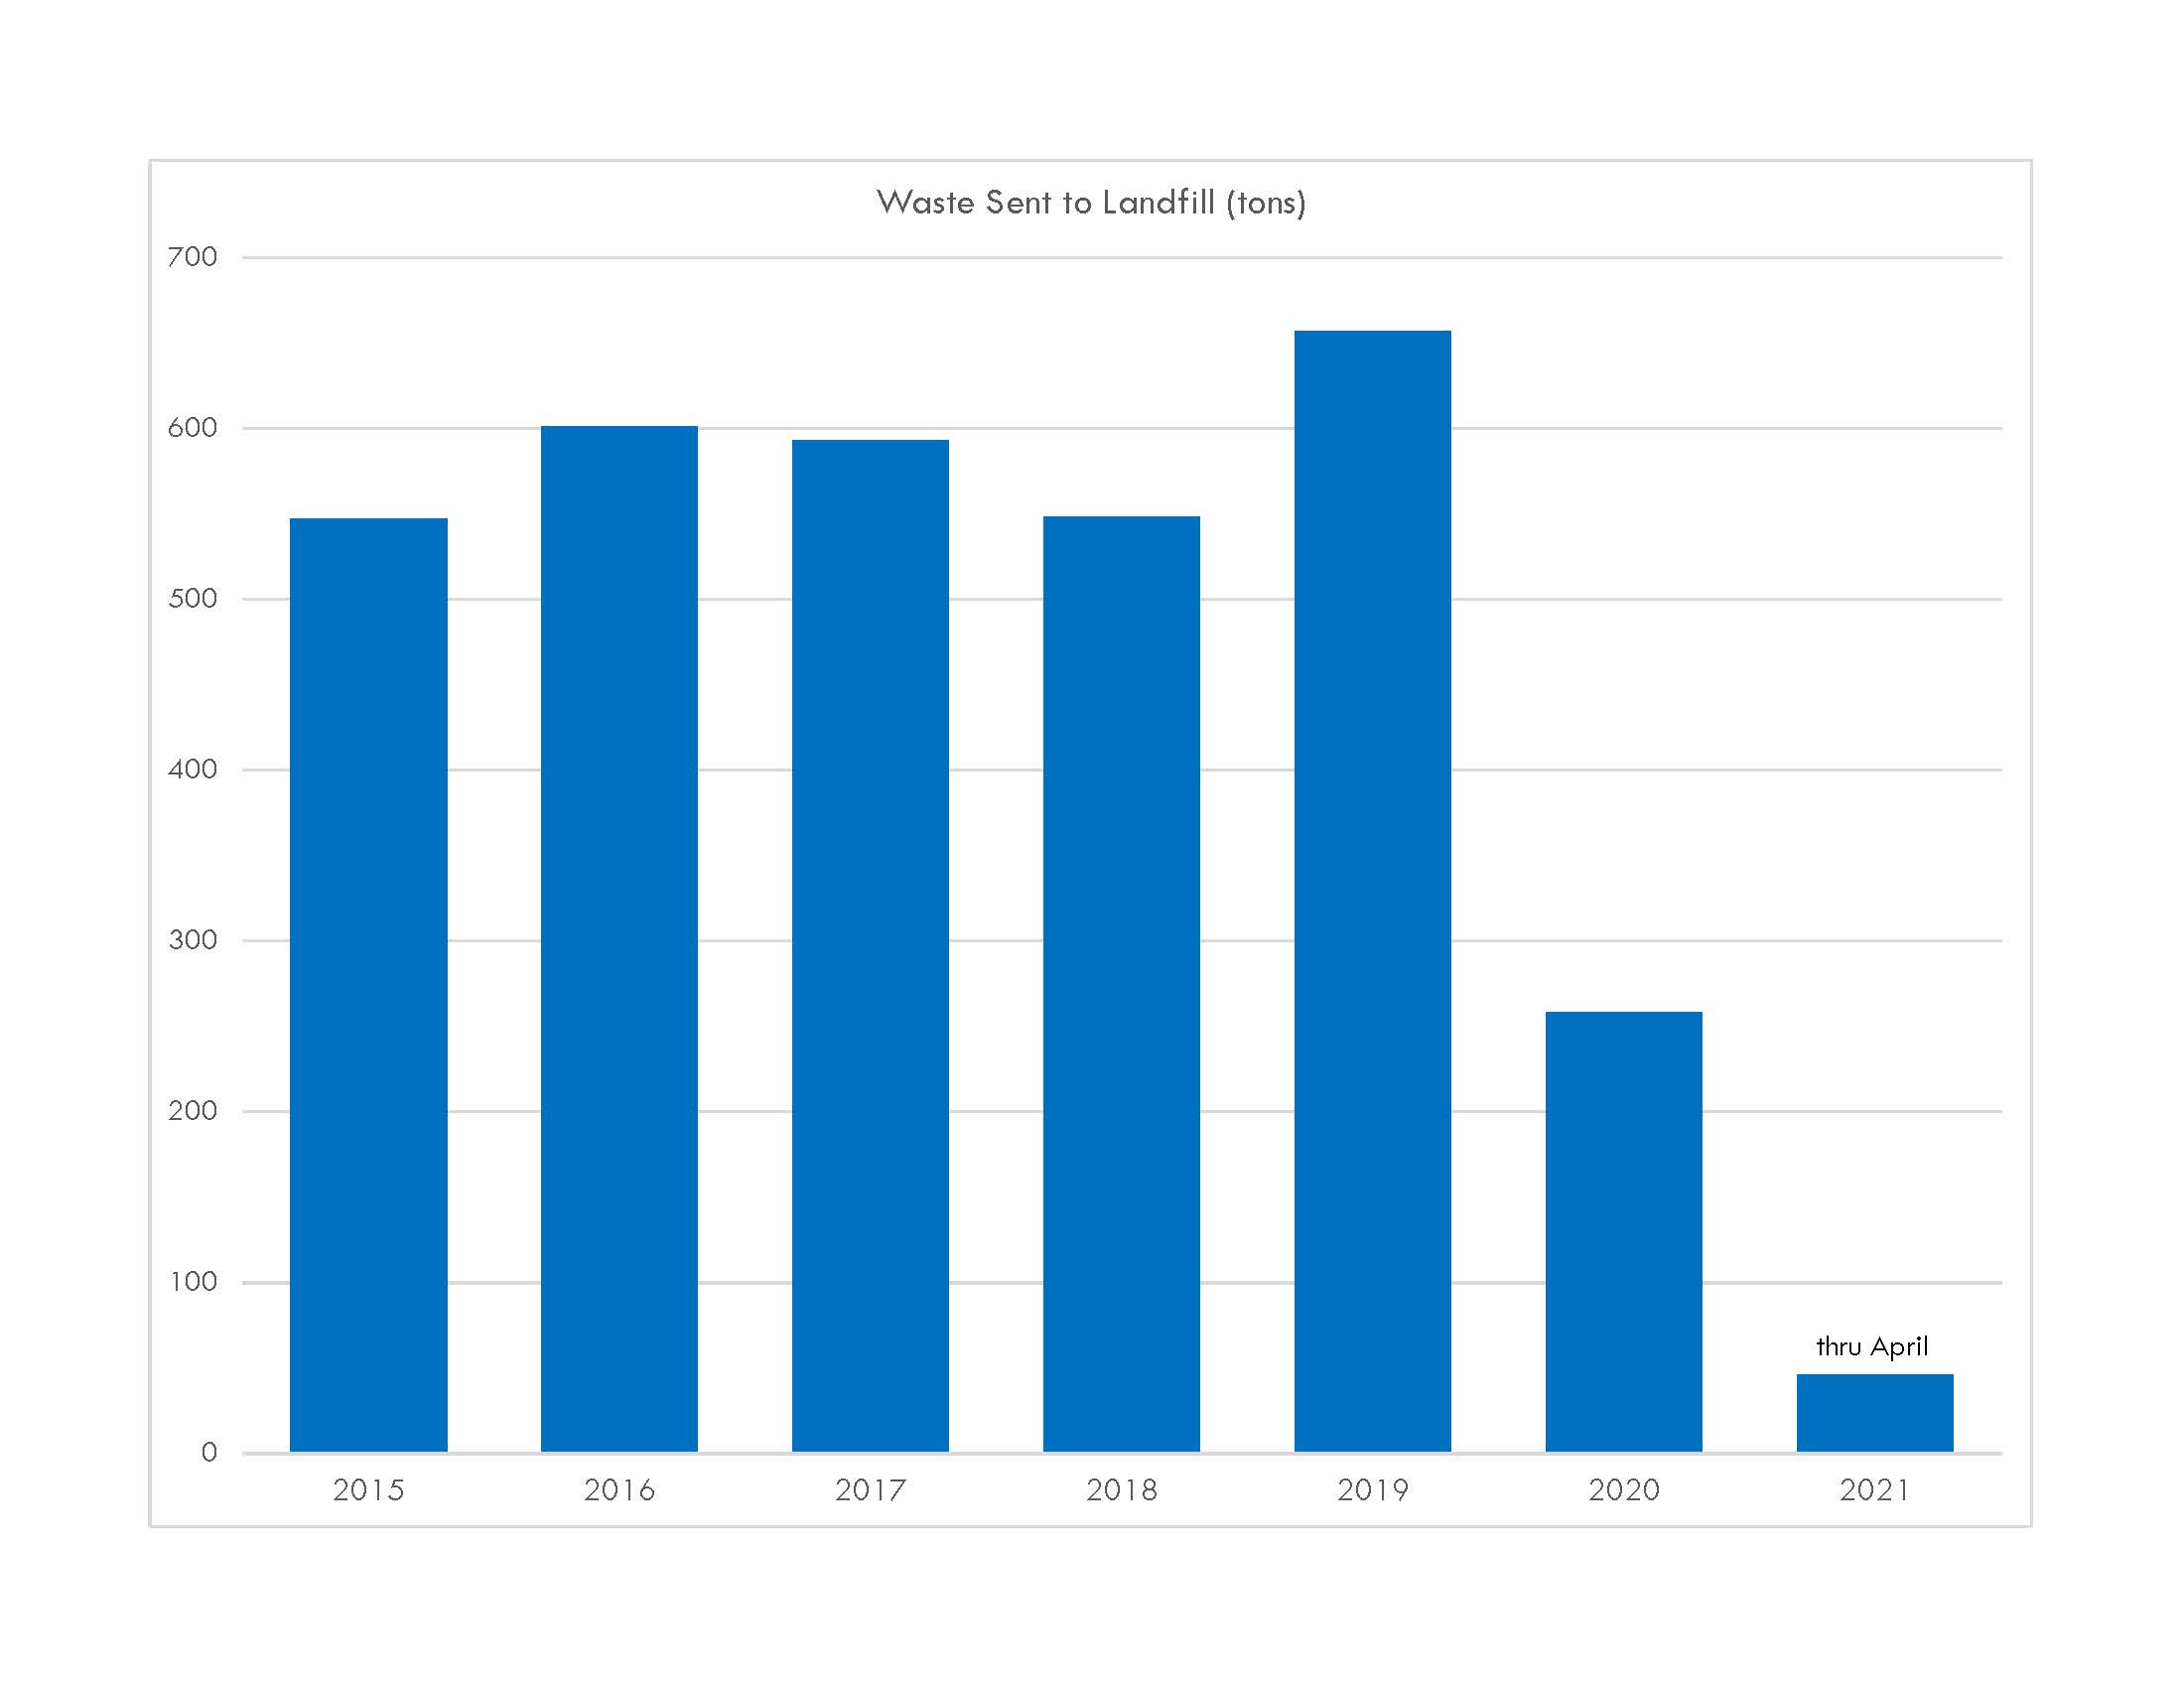
As part of our Zero Waste by 2025 goal we are tracking how much waste material campus sends to the landfill. Each year the campus population increases while we work with our community to increase sustainability education and reduce waste. In 2015 about 550 tons of material went to the landfill, with the next few years in the same range. In 2020 when the campus went remote approximately 250 tons of material was produced as building operations continued at a minimum basis.